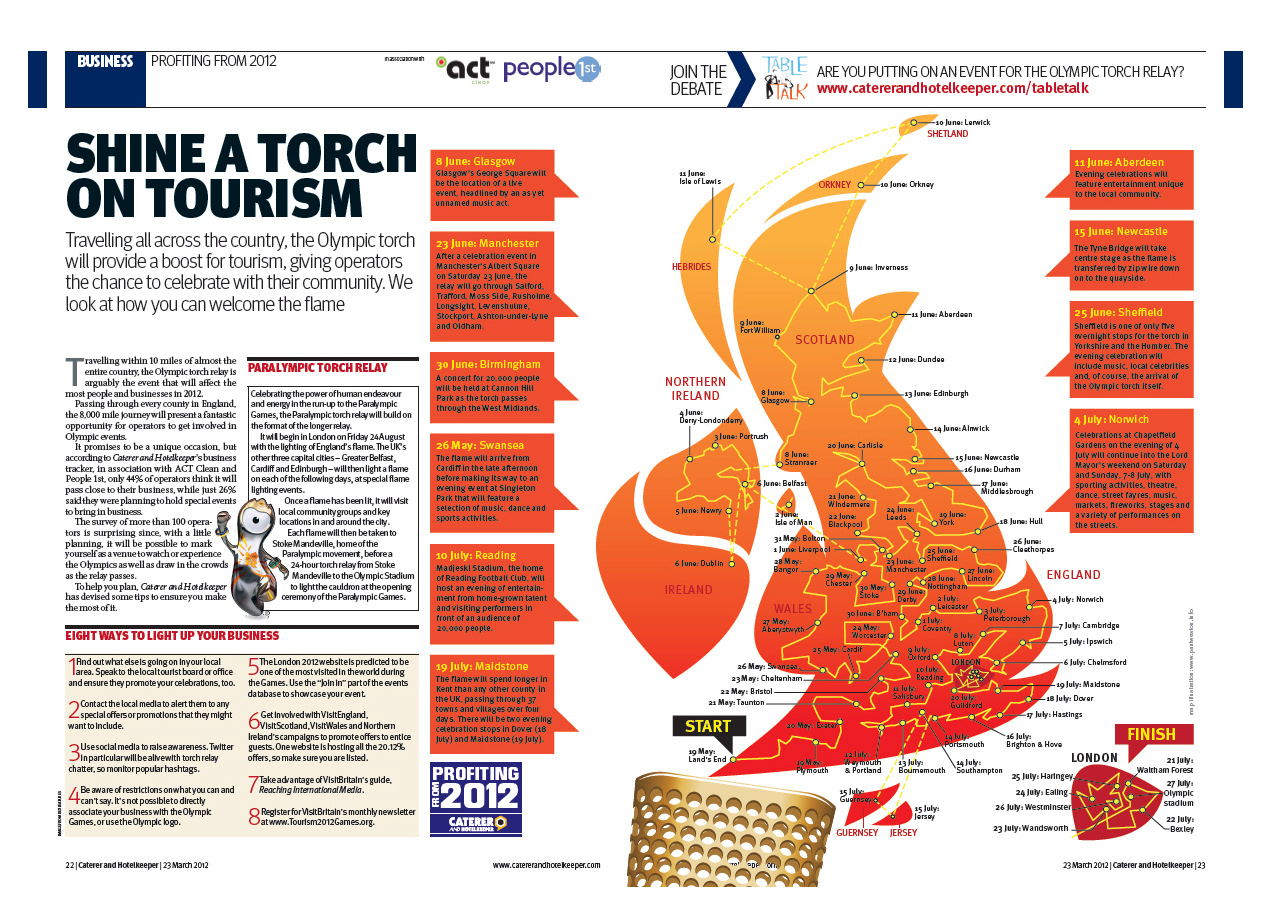
Back in 2012, I designed an exclusive infographic that showcased the Olympic torch's journey and its relevance to tourism. The infographic featured an eye-catching flame graphic shaped like the UK, highlighting the specific dates and locations where the torch made its appearance.
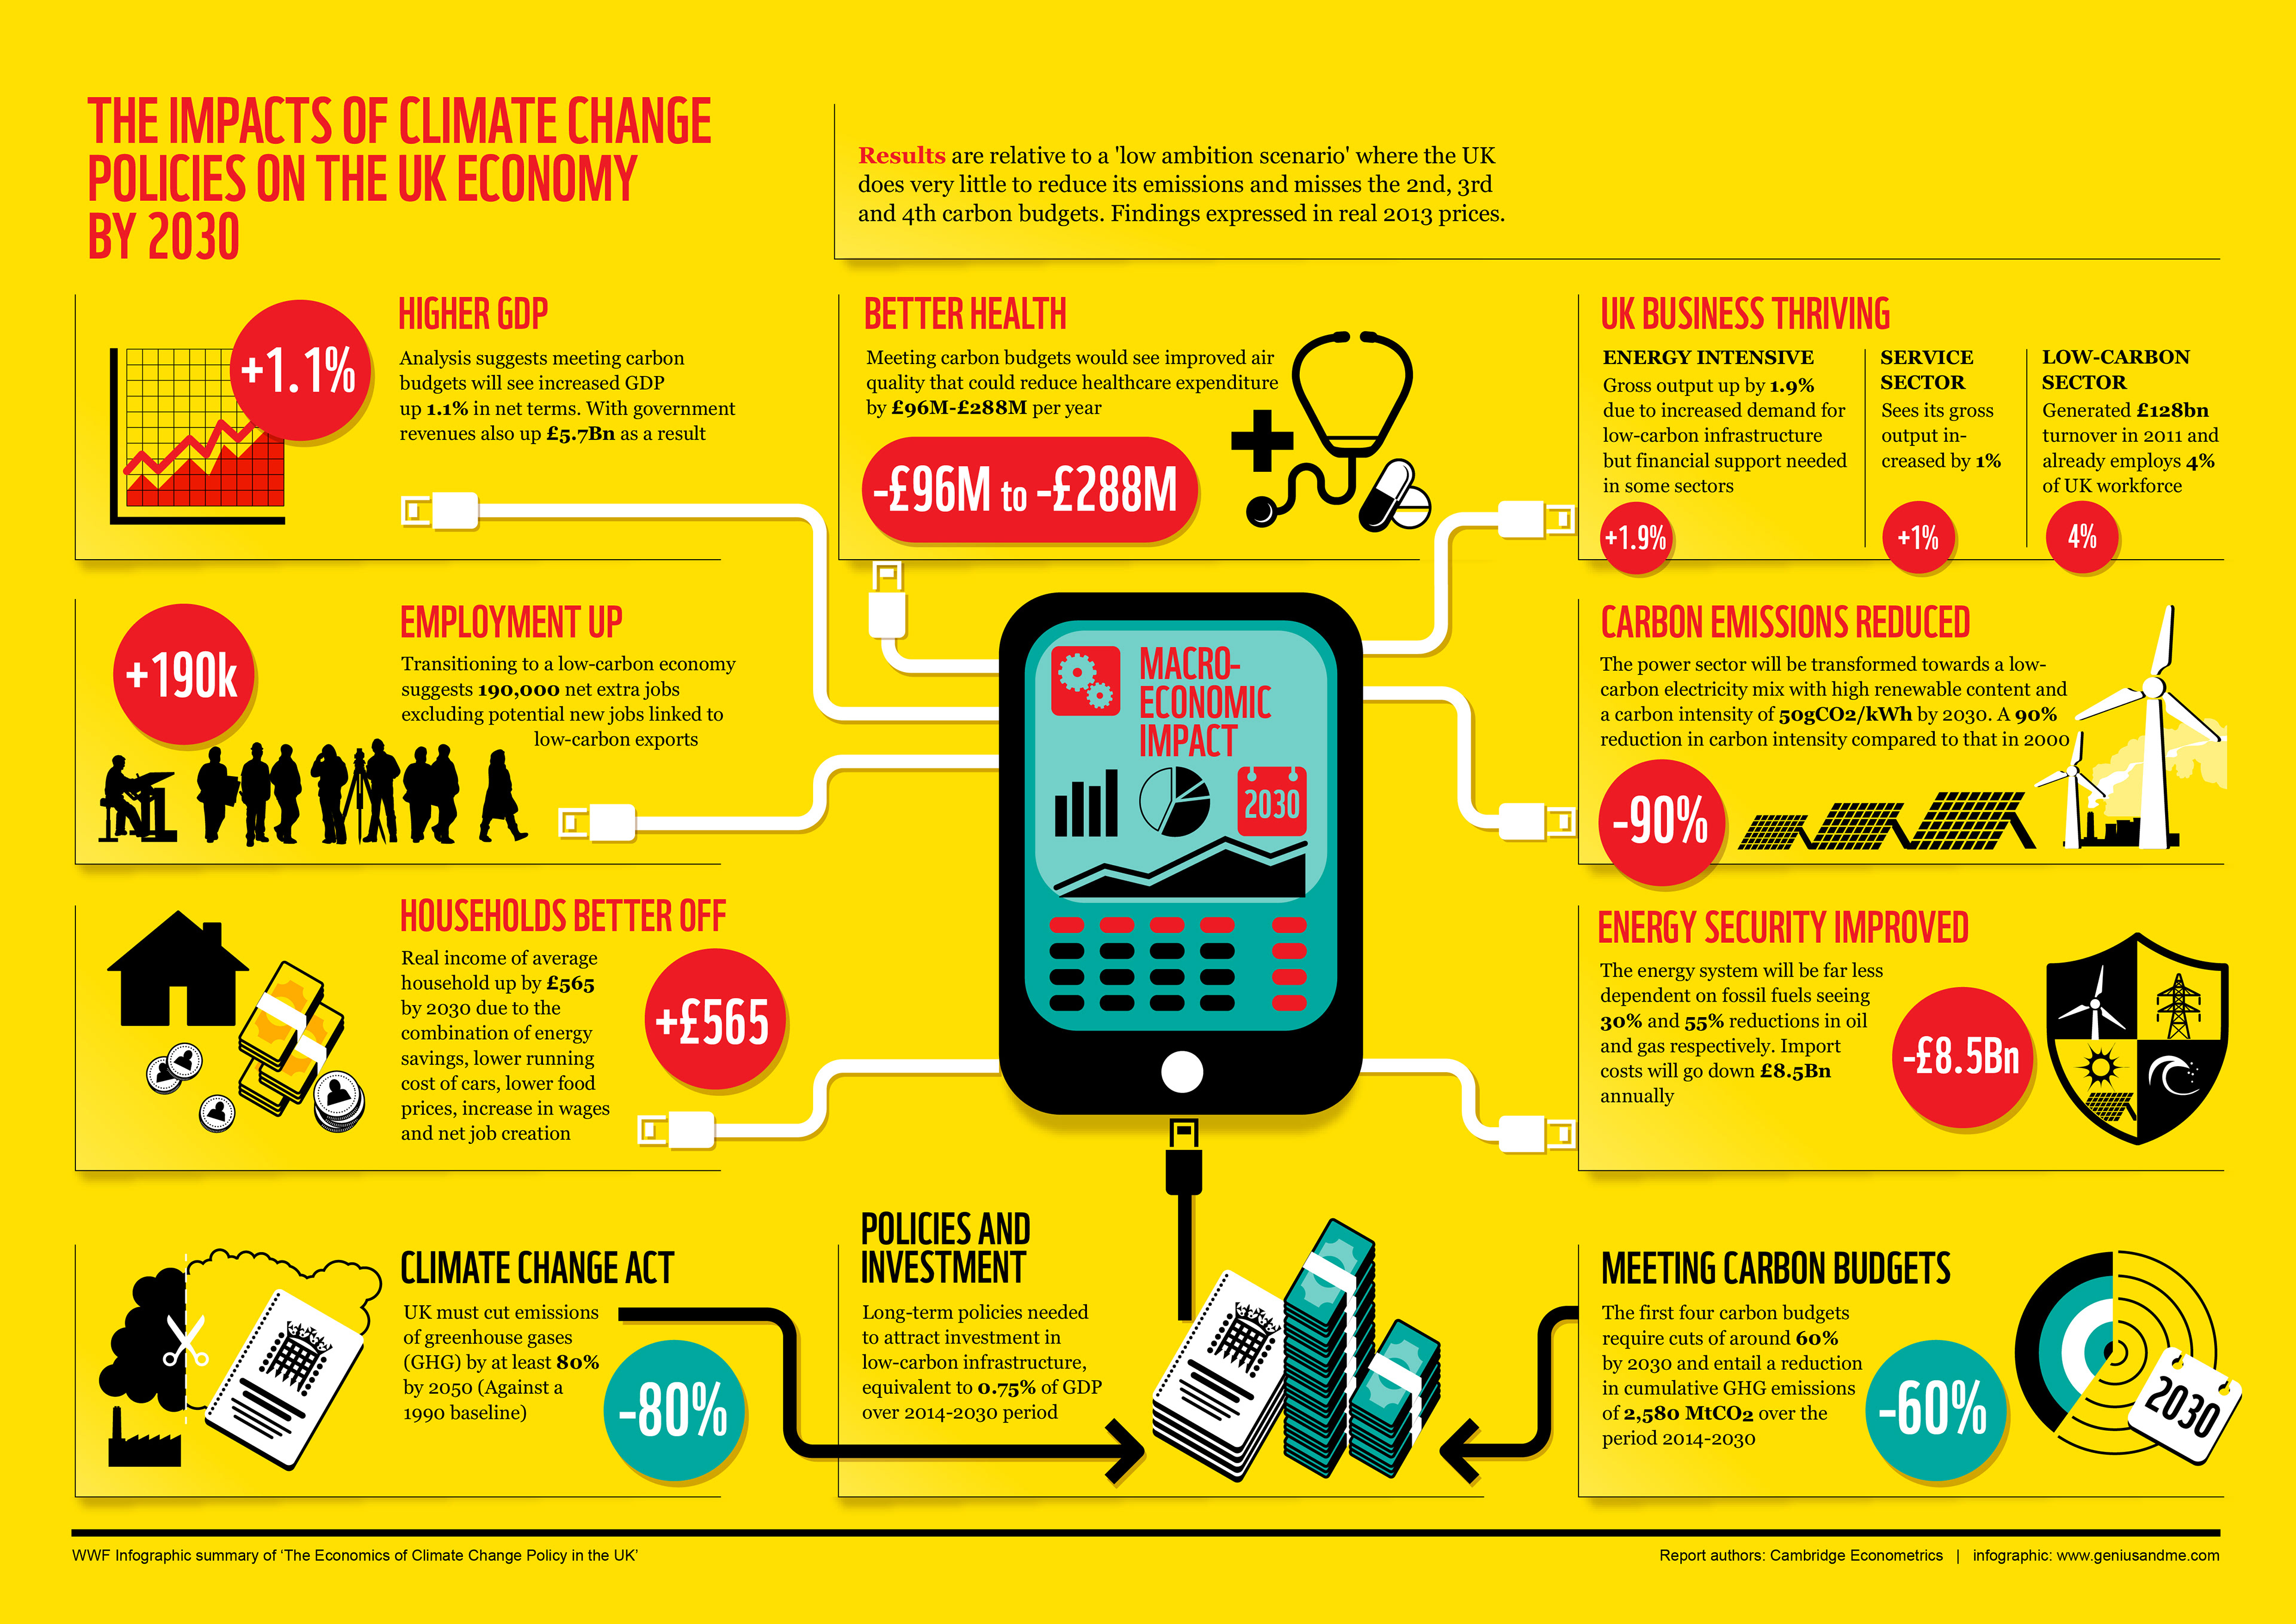
There are numerous infographic options available in various industries, and I take pleasure in designing unique pieces that not only exhibit exceptional visuals but also effectively communicate their intended message. One of our notable works is the Climate Change policy infographic, which provided captivating insights on how the UK economy could evolve by 2030. This subject matter is currently a prevalent and controversial topic, and this gave us an ideal opportunity to present factual data in a visually compelling manner. The outcome is a highly informative and impactful piece.
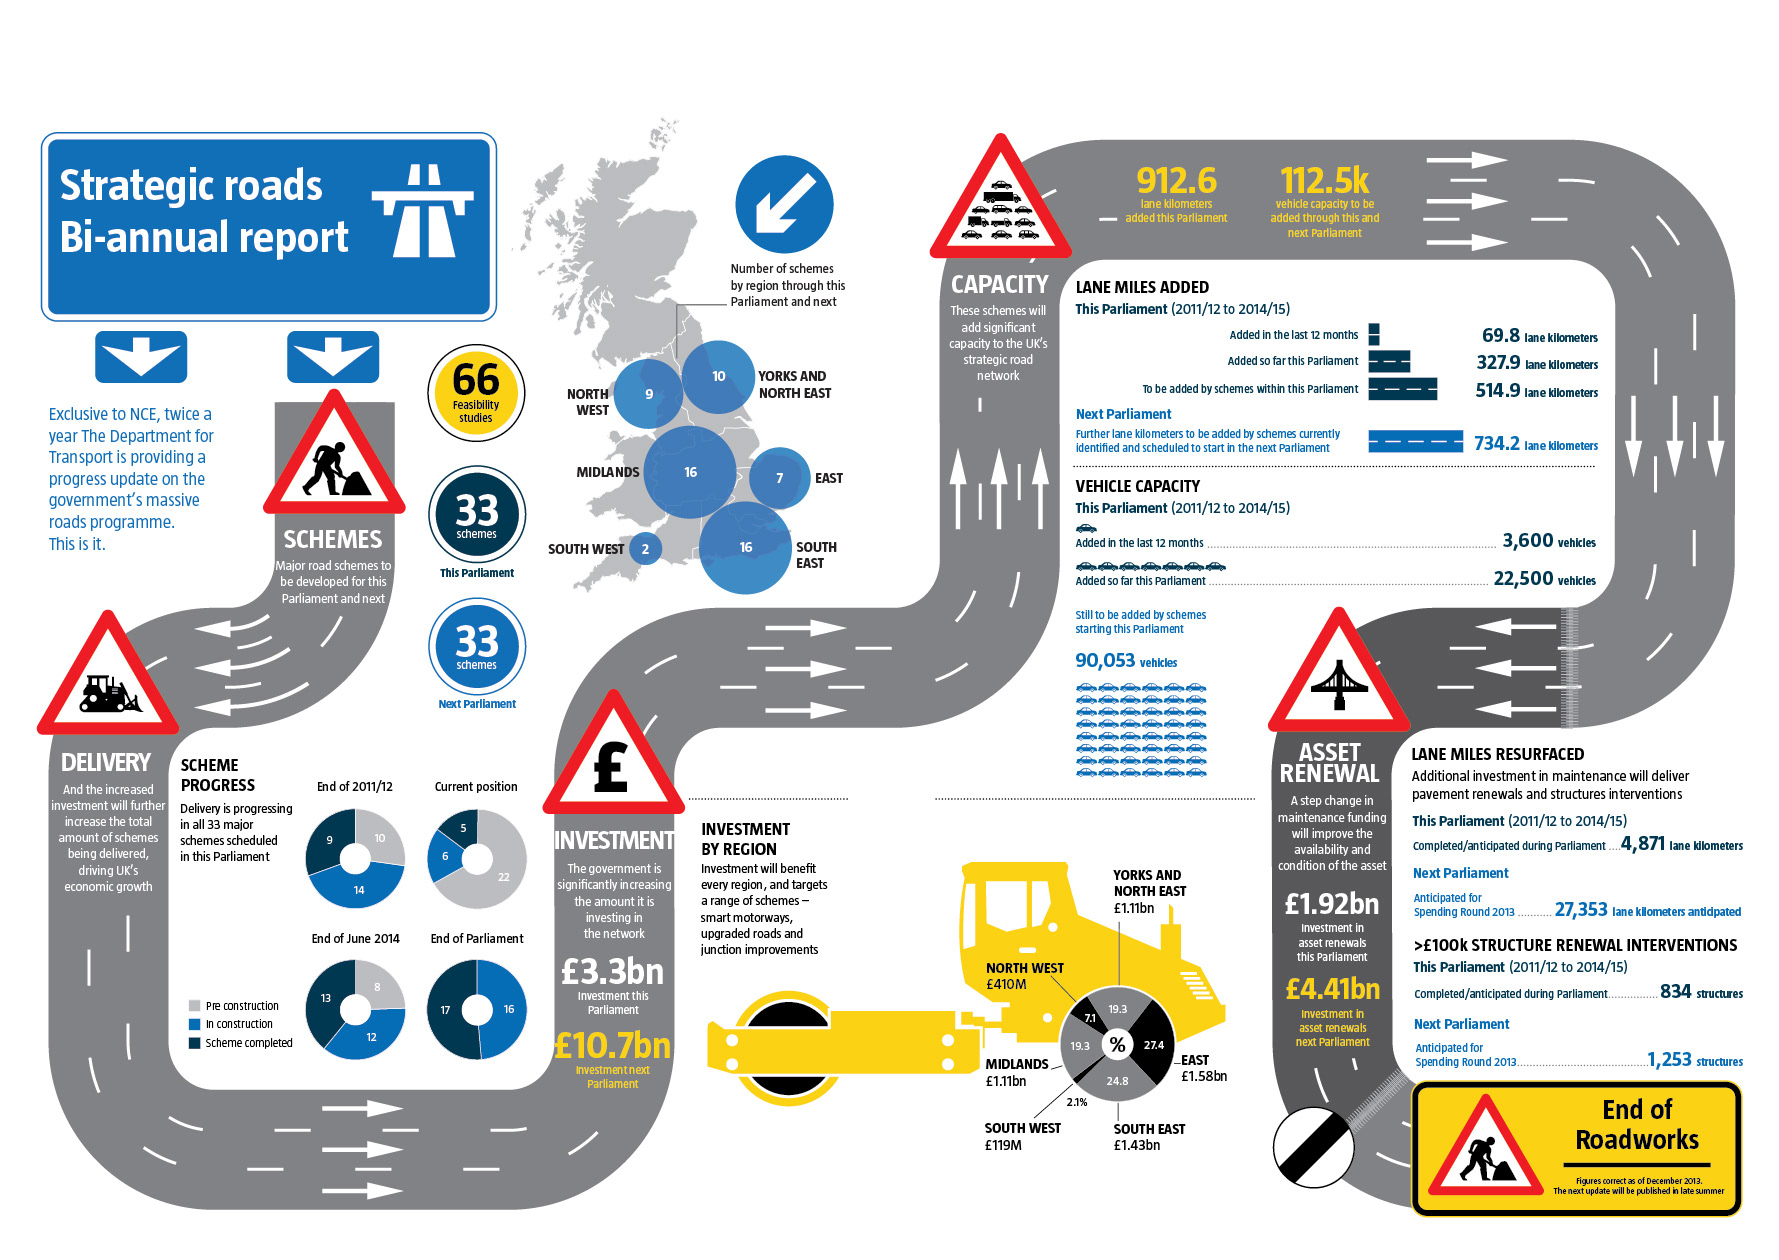
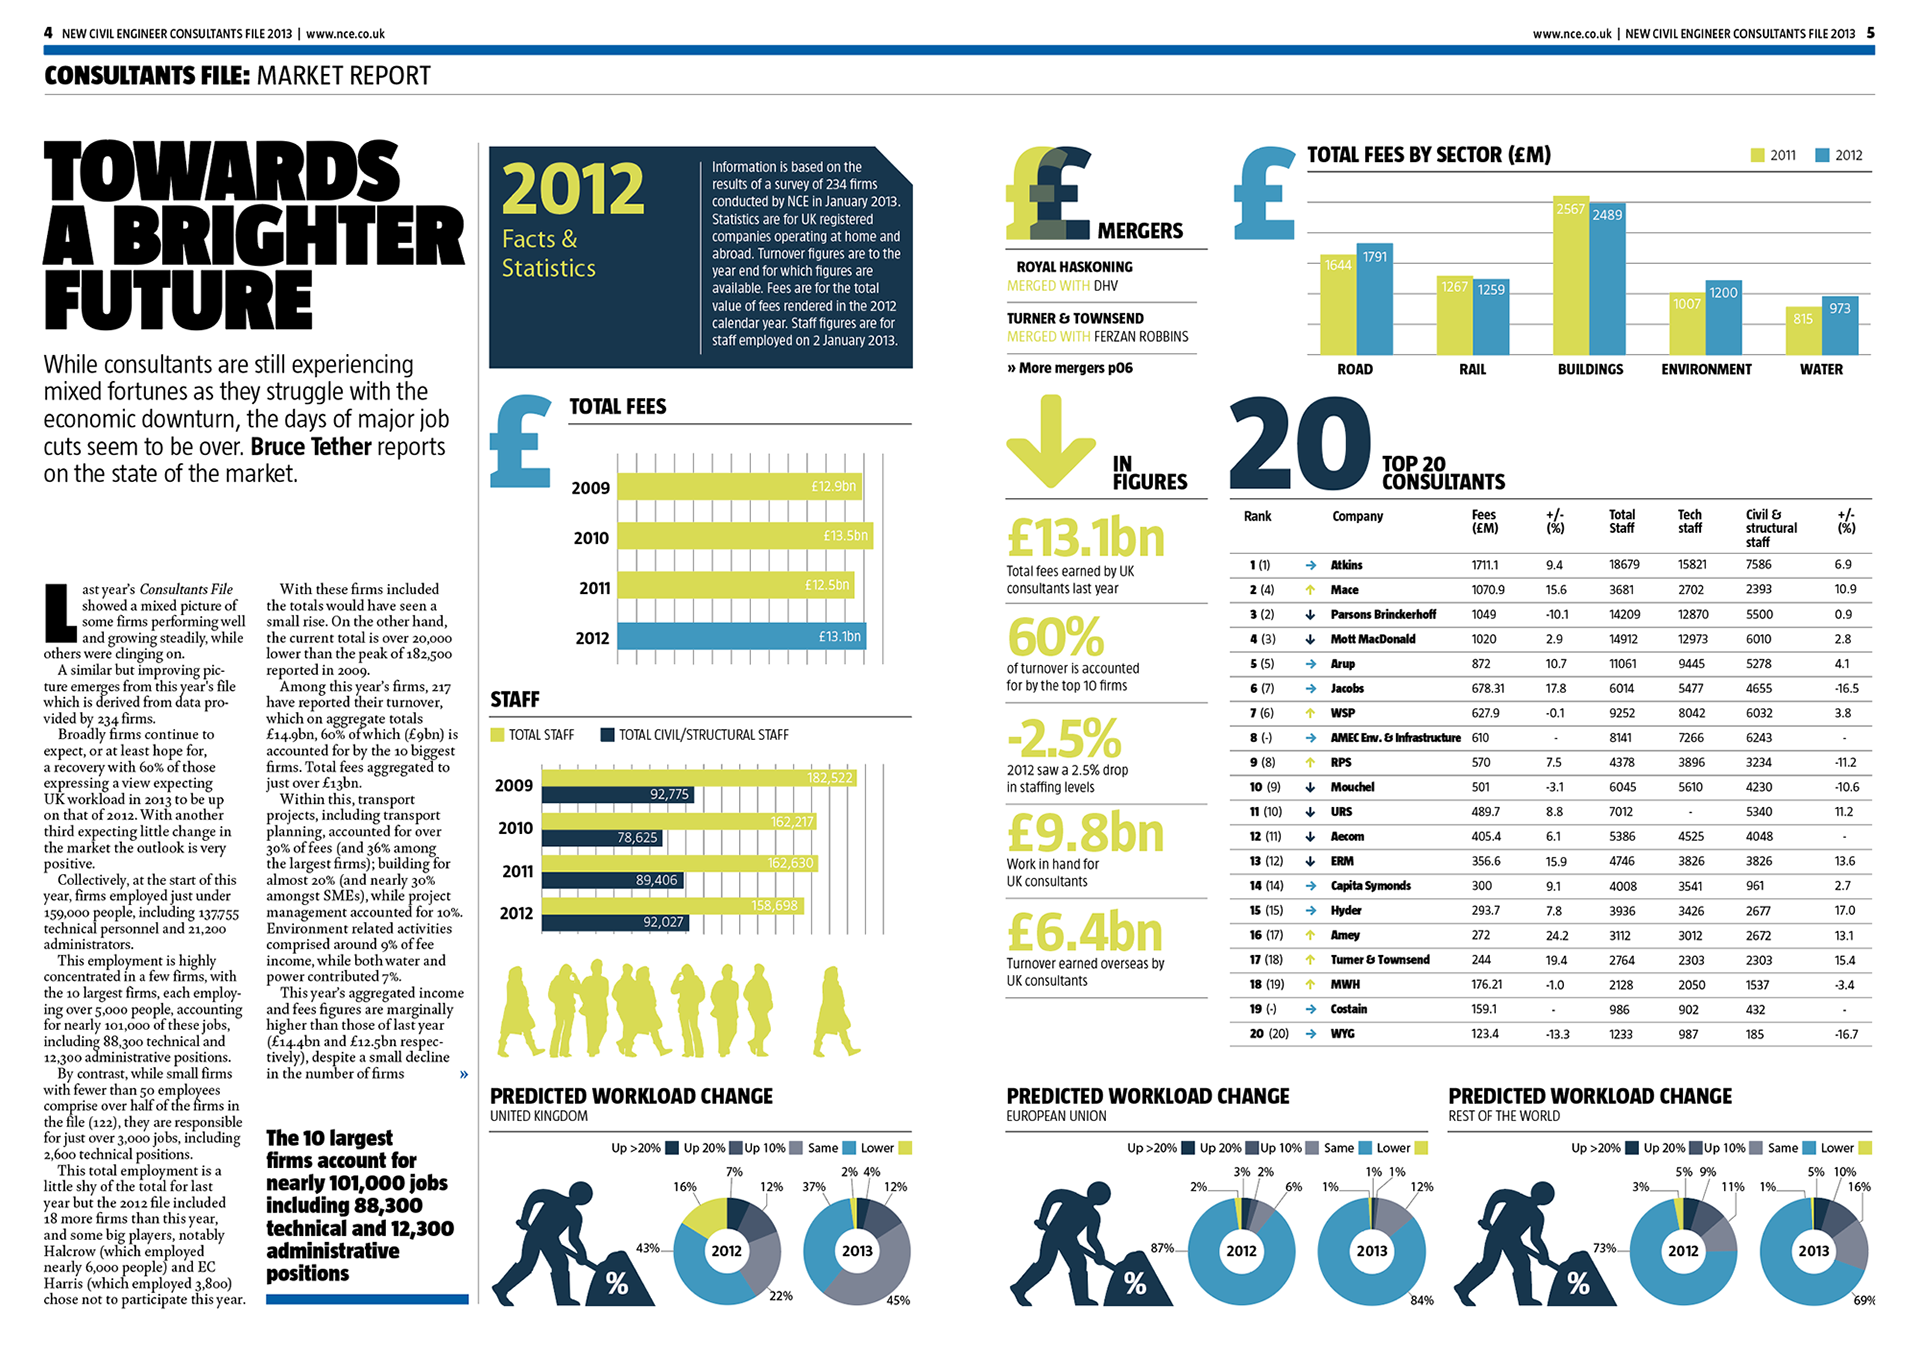
Infographic, illustration, information design, graphic, roads, visual executive summary, communication.
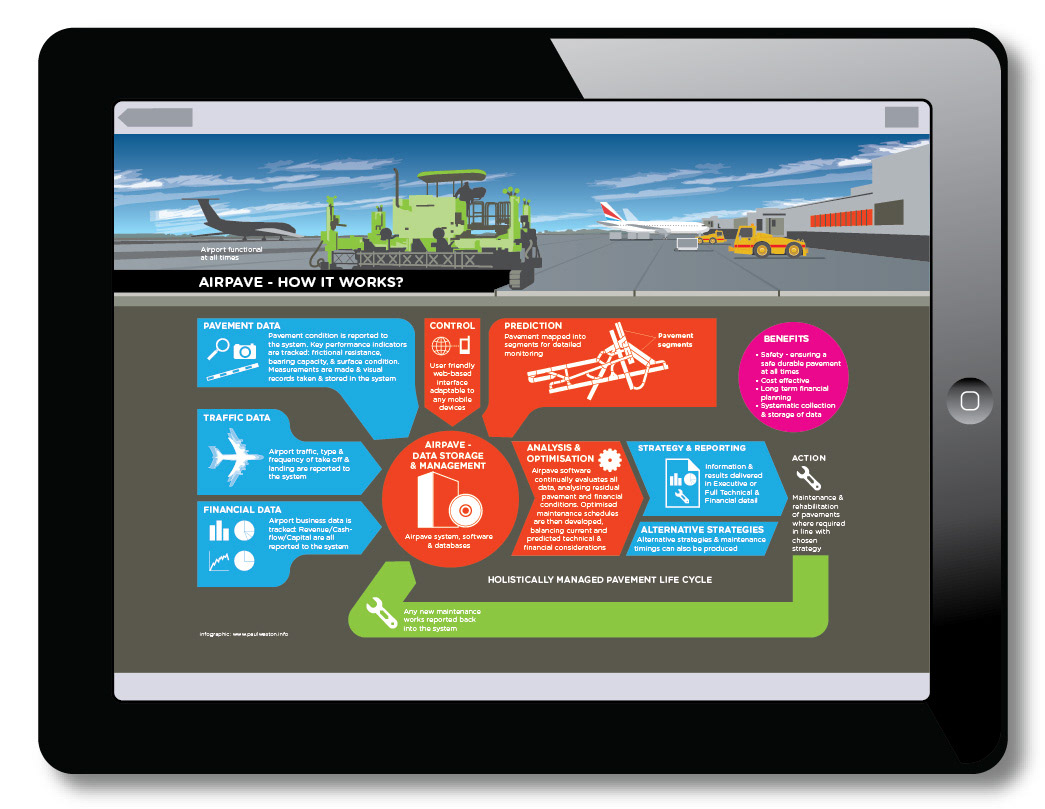
Infographic, illustration, software map, software mapping, software visualisation, communication.
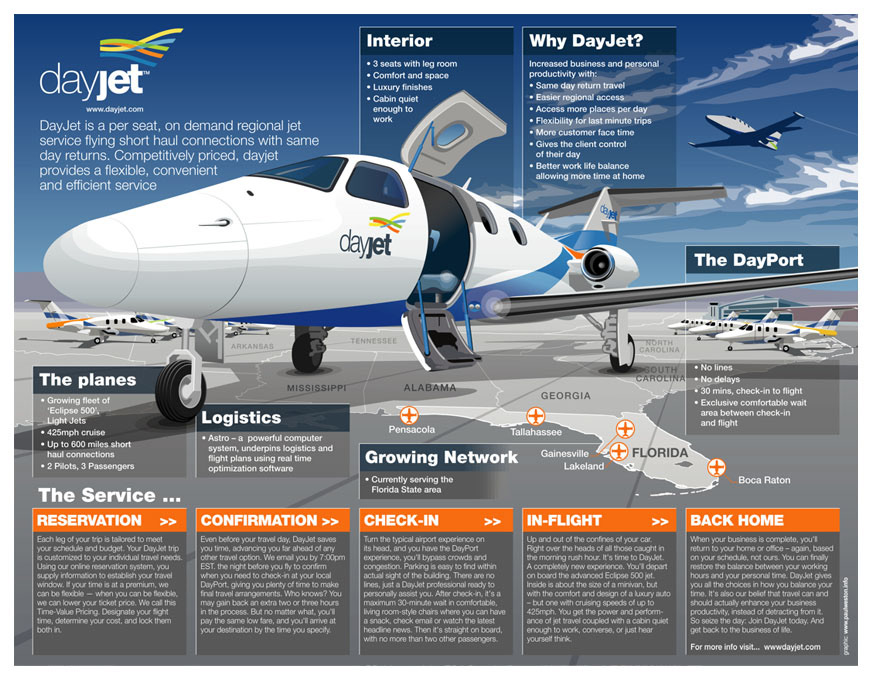
Infographic, illustration, technical illustration, visual communications, data visualisation.
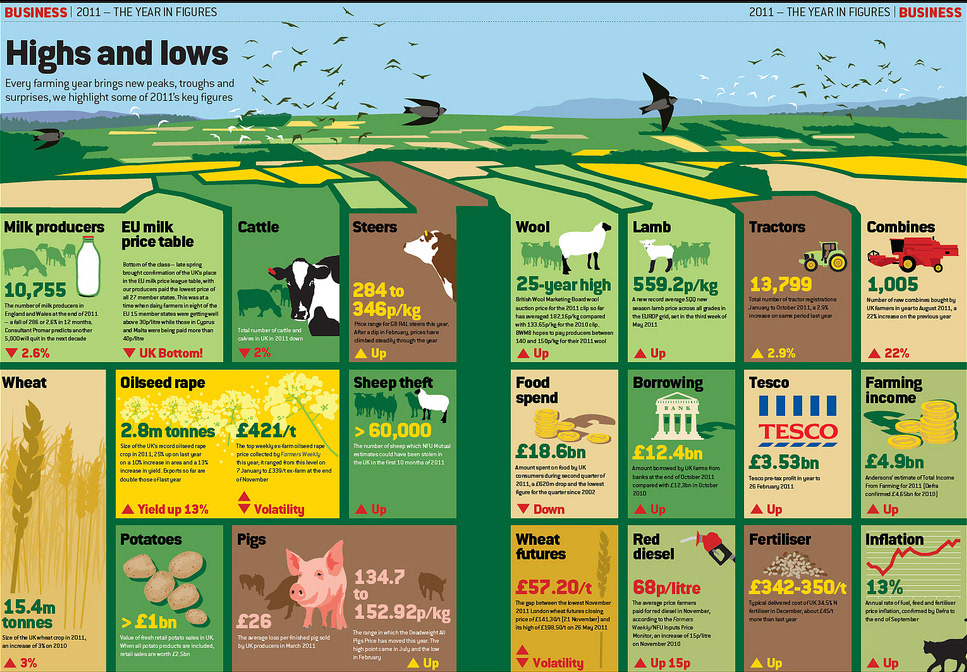
Infographic, illustration, farming, economics, magazine publishing, communication.
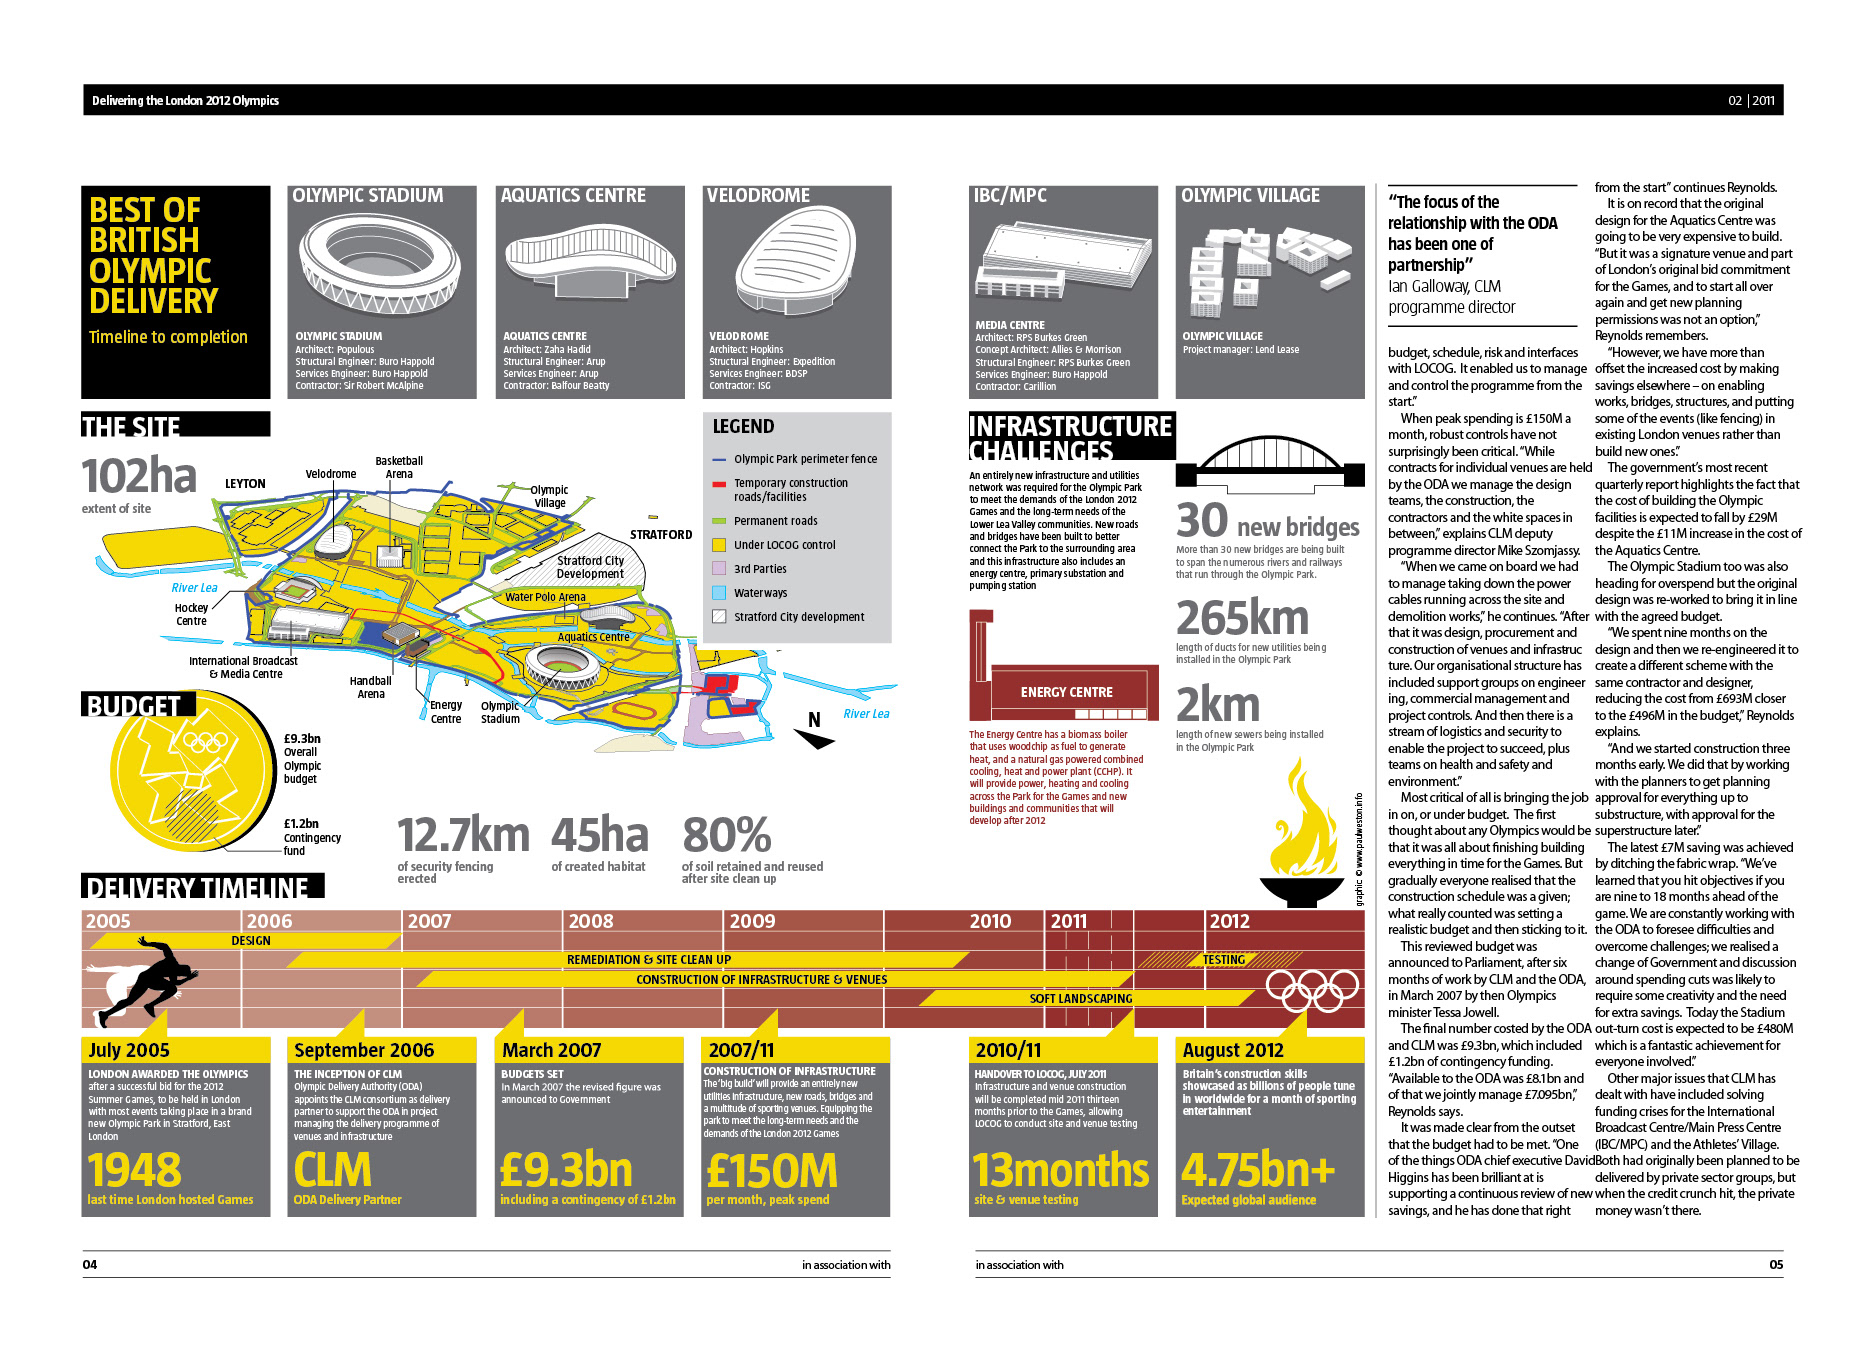
Infographic, illustration, press pack, technical illustration, timeline, map, olympics, communication.
Infographic, illustration, magazine publishing, technical illustration, map, communication.
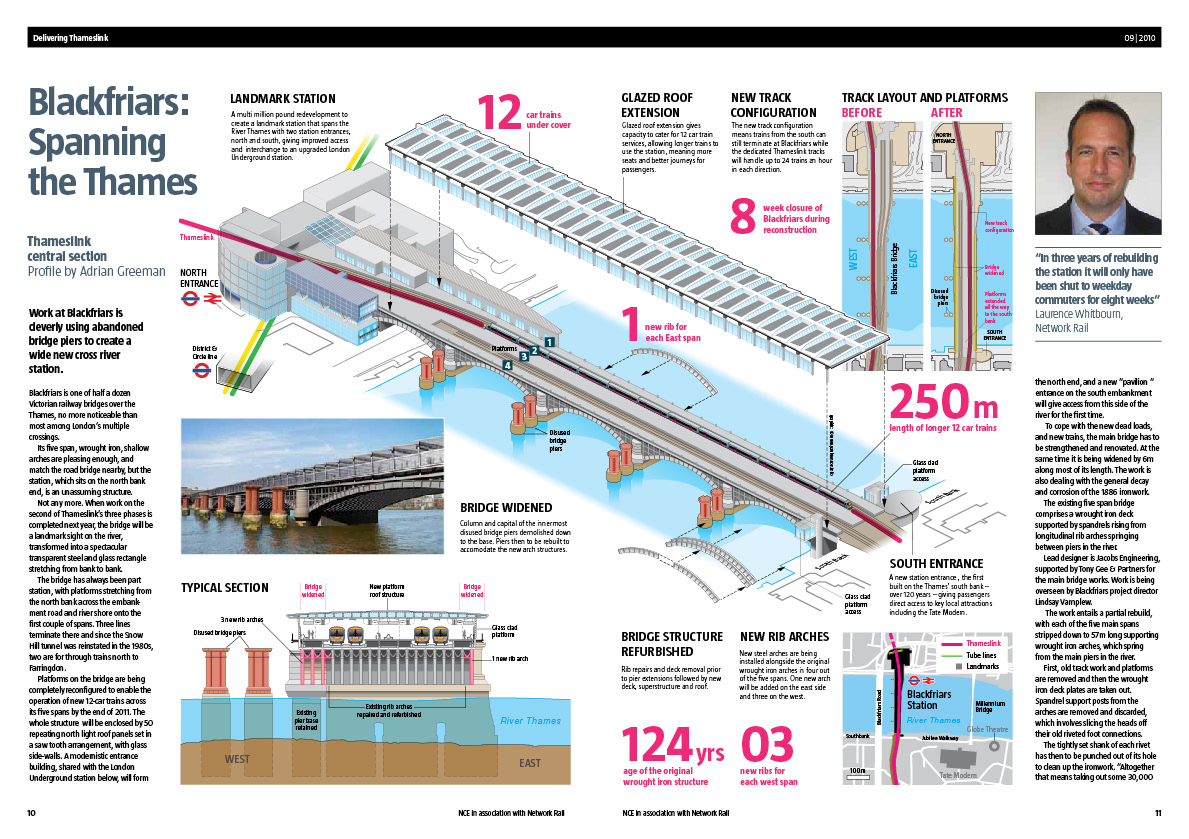
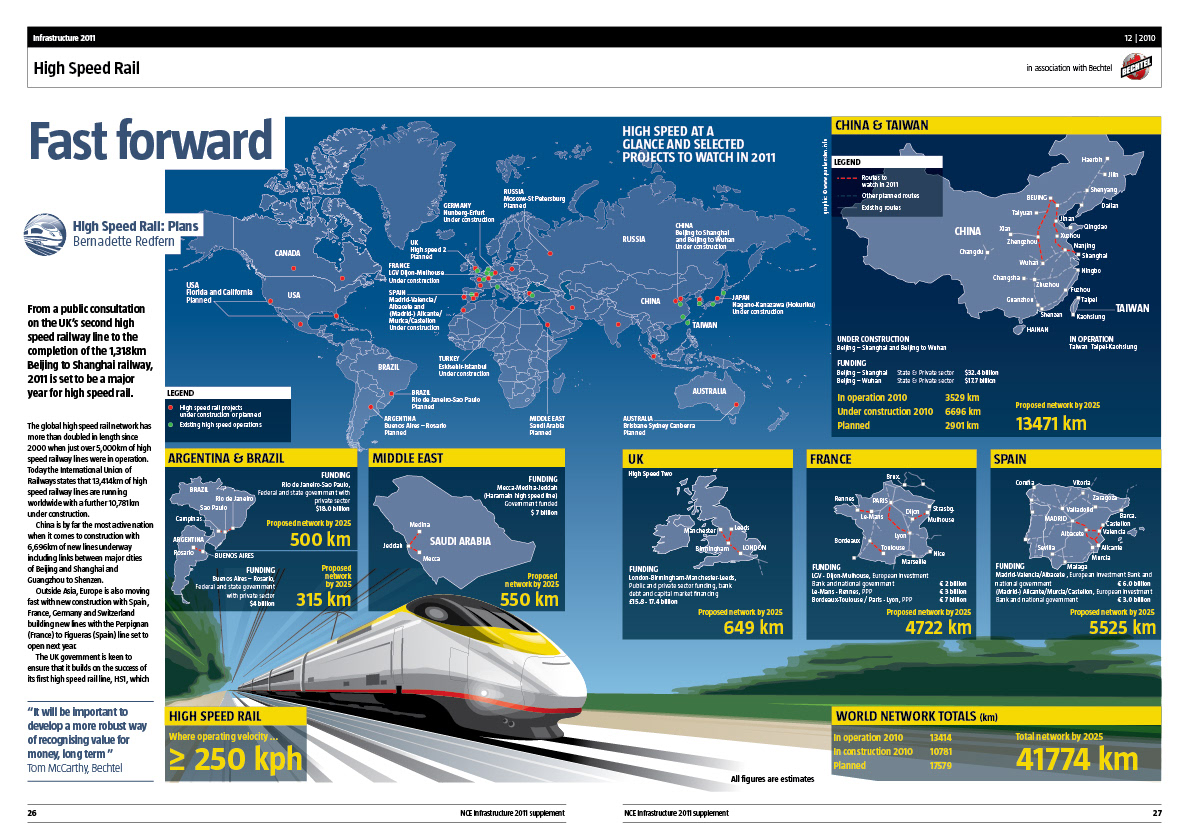
Infographic, technical illustration, rail infrastructure graphic, communication.
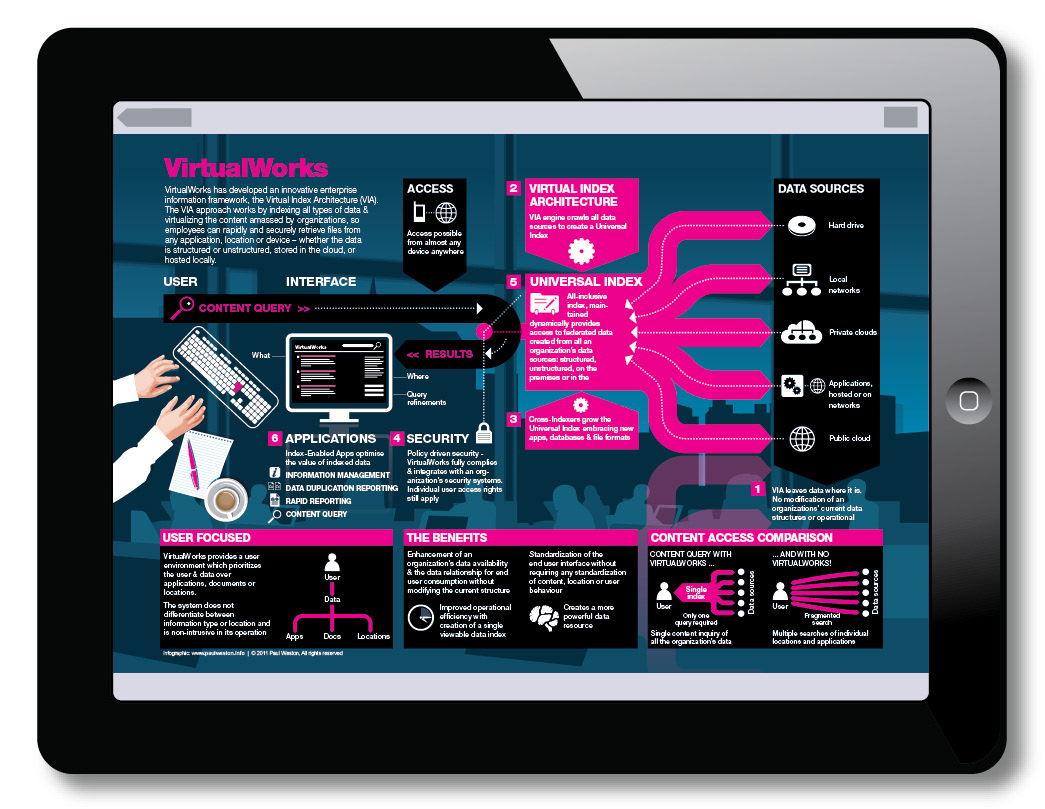
Infographic, illustration, software map, software mapping, software visualisation.
Infographic, illustration, press pack, map, communication.
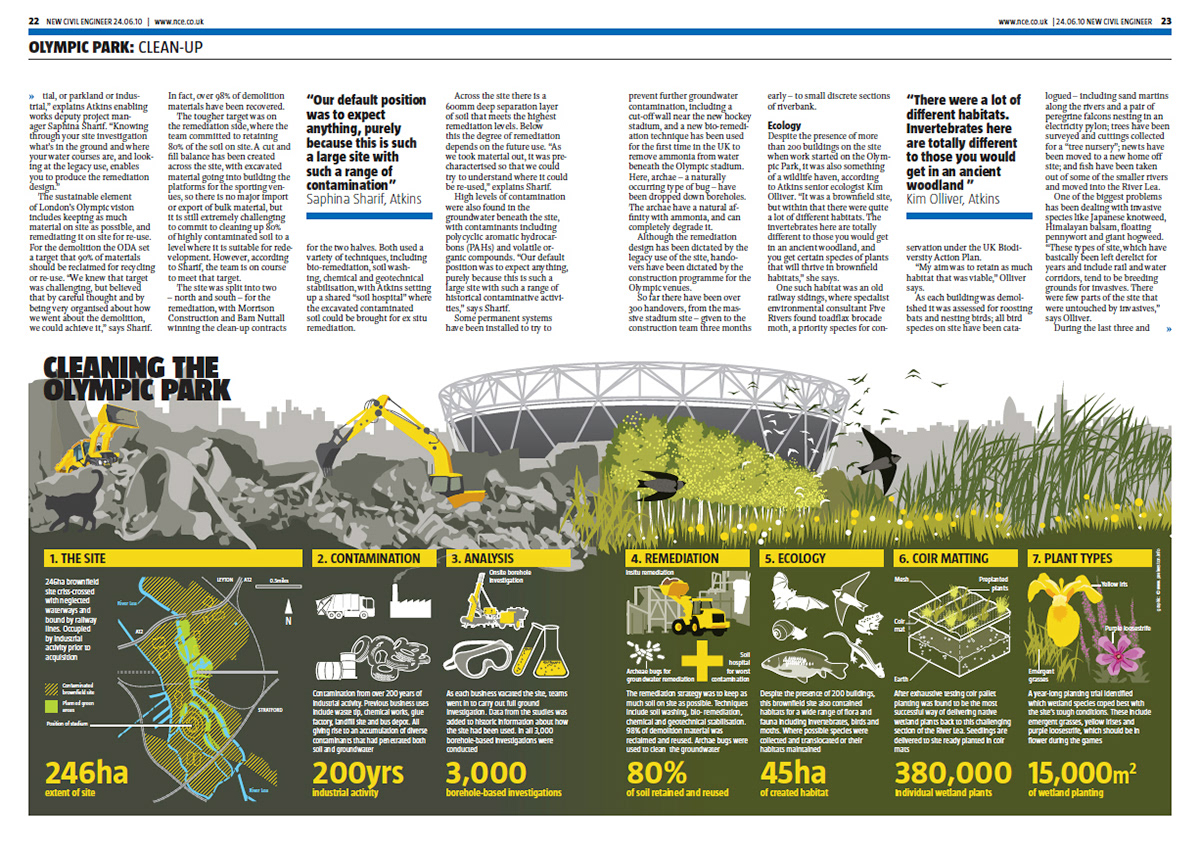
Infographic, illustration, remediation, magazine publishing, Olympics, communication.
Got a project? Give me a call or drop me a line and let’s see how we could work together.
t +44 (0)7976 642 503 | e p@ulweston.info